plotting with output, matplotlib, and yt
The following is based on a presentation given at the FLASH Center Astro group meeting on April 25th, 2012.
Context
The existing solutions were inappropriate for the following reasons:
- VisIt: Difficult to make publication worthy and even more difficult to reproduce.
- yt: Lack of full control over basic objects (labels, legends, color maps, etc).
We are going to need a bigger boat...
Key Points
- Though it is marketed as a visualization tool, yt is a fully-fledged analysis platform for FLASH.
- Since yt is well-factored, the visualization & analysis two feature sets are distinct.
- Thus we can replace yt’s plotting functionality with something easier and more empowering to the user.
- (cough matplotlib)
Output Module
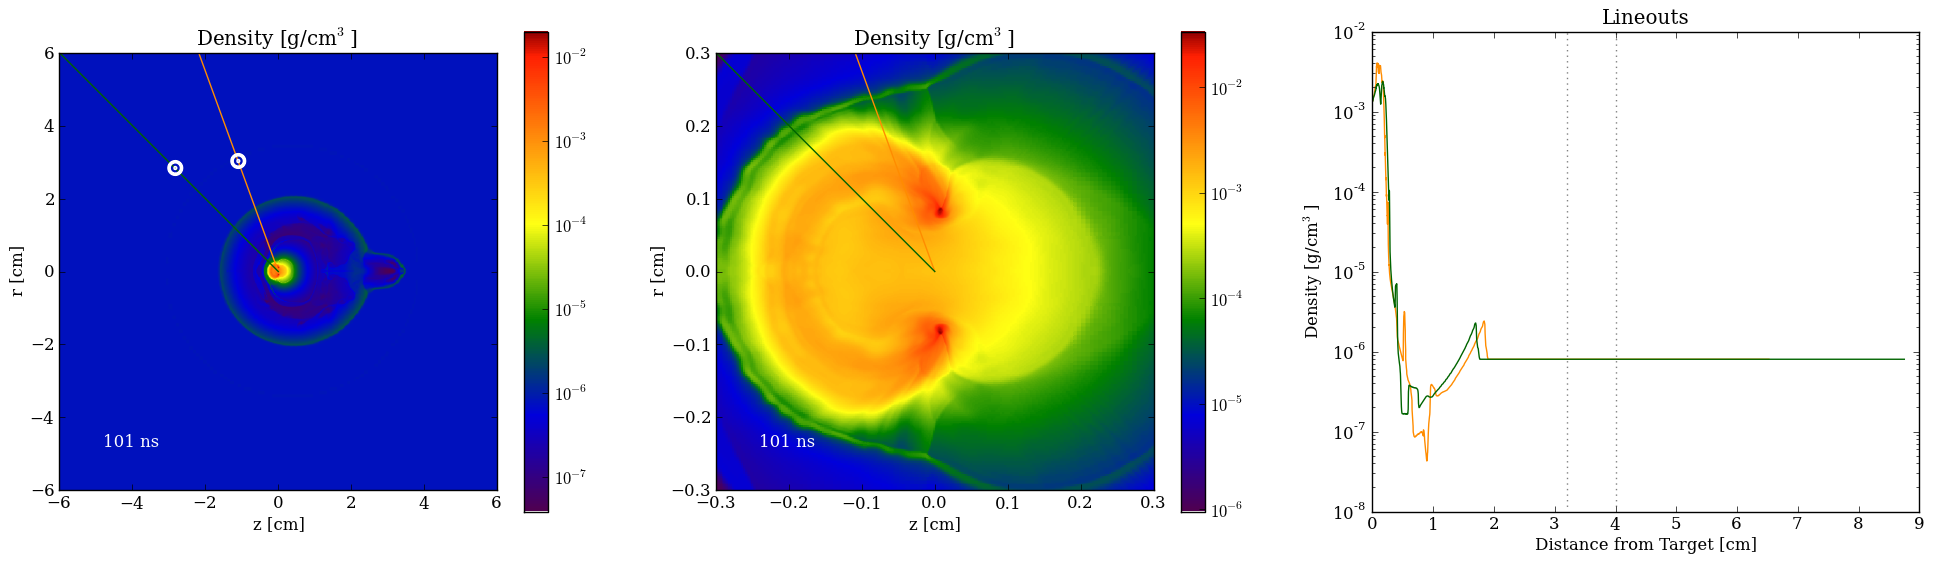
In the flash namespace we now have access to the output module which contains several functions which return raw data that is suitable for plotting:
from flash.output import *

lineout(p1, p2, field, pf, **kwargs)
shock_on_lineout(p1, p2, field, pf, threshold=1e-06, min_threshold=1e-36, **kwargs)
slice(axis, coord, field, pf, bounds=None, resolution=600, method='nearest', **kwargs)
slice_gradient(axis, coord, field, pf, bounds=None, resolution=600, method='nearest', **kwargs)
Lineouts can be piped to the matplotlib plot() function while the slices can be sent to imshow().
Projections could be easily added.
A Quick Example
In a terminal, run:
$ mkdir temp
$ cd temp
$ flmake setup -auto Sedov
$ flmake build -j 20
$ flmake run -n 20
Then in Python, run:
from flash import output
import matplotlib.pyplot as plt
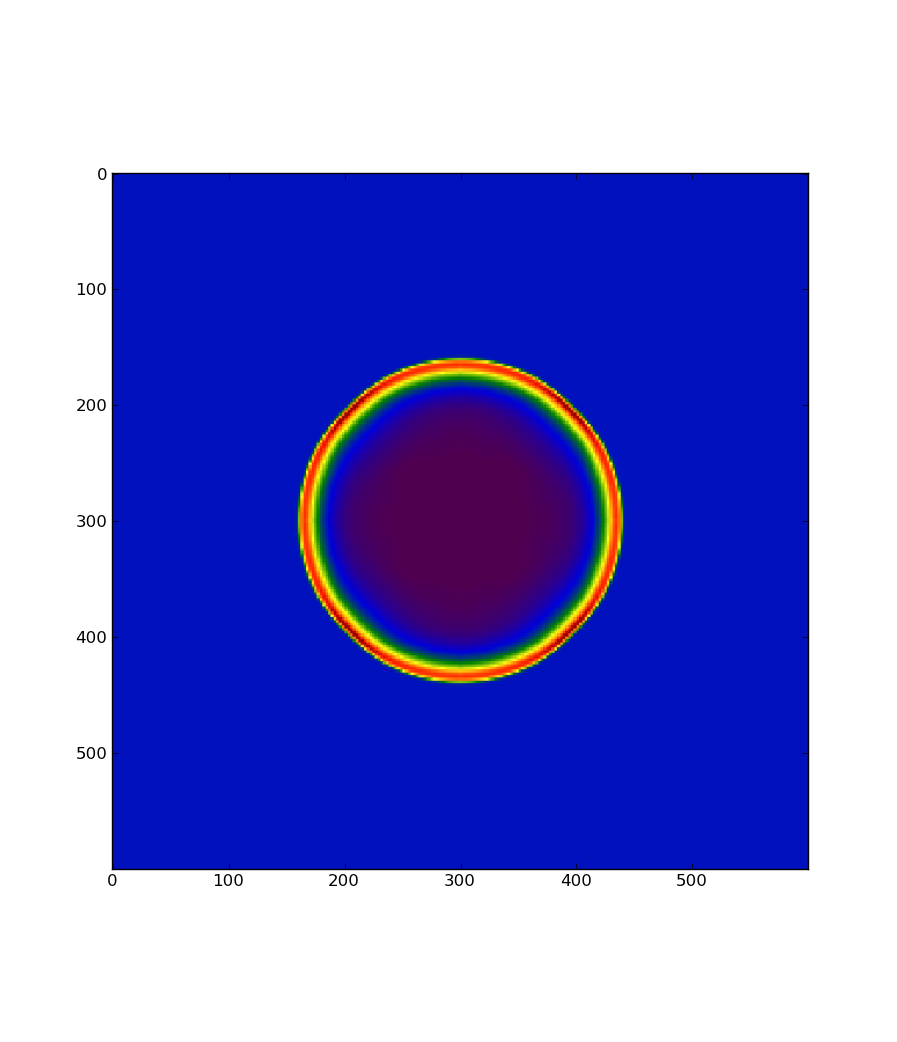
x, y, z = output.slice(2, 0.0, 'dens', "<path to chk>")
plt.imshow(z)
plt.show()
You should see something like:
What is yt doing?
- Under the covers, yt has file handlers called plotfiles (pf) which live in plot collections (pc).
- On the pf live Hierarchy objects (aliased h) which provide a common interface for common operations (ray, slice, projection, etc) for all supported file type.
- These operations follow a pattern whereby they return special mappings keyed by fields (dens, etc). For flash, pf.h.slice() will return an amr_slice[field].
If this wasn’t confusing enough, these mapping are lazily evaluated. The fields don’t necessarily exist until you ask for them:
In [7]: amr_slice.fields
Out[7]: ['dens', 'px', 'py', 'pz', 'pdx', 'pdy', 'pdz', 'x', 'y', 'z']

In [8]: amr_slice['targ']
Out[8]: array([ 0.47239542,  0.47150037,  0.4828257 , ...,  0.        ,
                0.        ,  0.        ])

In [9]: amr_slice.fields
Out[9]: ['dens', 'px', 'py', 'pz', 'pdx', 'pdy', 'pdz', 'x', 'y', 'z', 'targ']
What is the output module doing?
- The point of the output module is to abstract a lot of these under-the-cover yt issues.
- Moreover, it is faster than pure yt because it caches the special hierarchy mappings to prevent excessive re-reads (ie changing the resolution will only read in all the slice data the first time).
output.ray_cache
output.slice_cache
Furthermore since we are sitting on the yt analysis layer, we have access to all of their capabilities - including derived fields.
from yt.data_objects.field_info_container import add_field

# register electron density field
def _edens(field, data):
    return data['ye'] * data['dens'] * data['sumy'] * 6.022E23

add_field ('edens', function=_edens, take_log=True)

# use this field with output functions
x, y, z = output.slice(2, 0.0, 'edens', "<path to chk>")
Summary
- The yt back end is great and gets us 90% of the way there. However, its front end visualization is a little too crippled for daily use.
- Using matplotlib instead gives us the perfect combination of data model and view.
- Some convenience functions which glue these two together have already been written. More can be added and already have a place to live!